
If you’re not an engineer, you may never think about the size of the pipes running throughout a building. Fortunately for the rest of us, engineers do think about pipes, and it’s a far more complex topic than many of us realize.
Generally speaking, it’s an engineer’s job to specify the smallest pipe size that will provide sufficient water pressure for every fixture in the building to function normally. And that decision depends on accurately estimating peak water demand.
For decades, engineers have based their peak water demand estimates on a formula dating from 1940. Now, Sloan’s chief scientist, Kay Herbert, PhD, has developed a new formula that yields more accurate water demand estimates—ideal for modern engineers grappling with green technology, touch-free fixtures, and hygiene concerns in the post-COVID-19 era.
If you’re a plumbing engineer, you’ll want to download Dr. Herbert’s white paper. And if you’re not, you should download it and share it with the engineers on your team.
Why Estimating Water Demand is So Important—and So Difficult
Why is it so important to specify the right size pipes for a building?
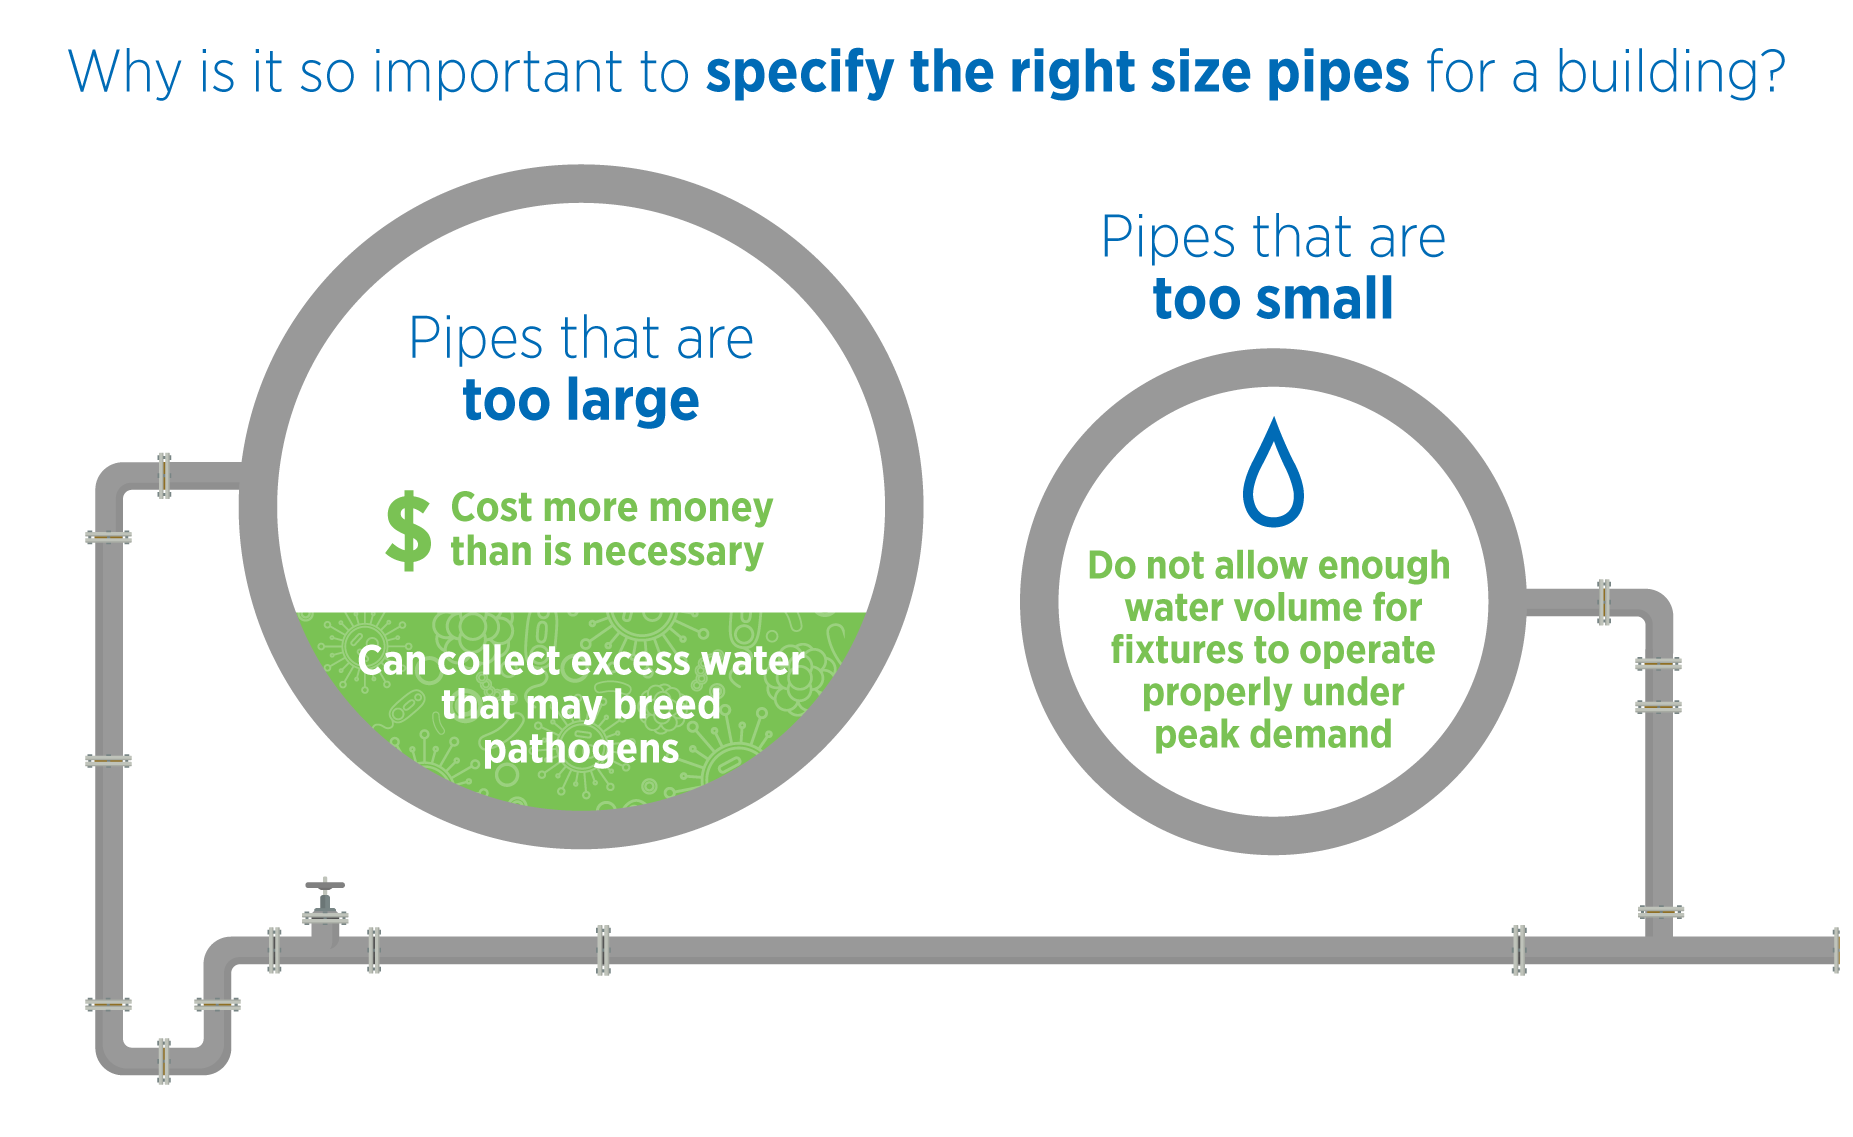
- Pipes that are too large
- Cost more money than is necessary
- Can collect excess water that may breed pathogens
- Pipes that are too small
- Do not allow enough water volume for fixtures to operate properly under peak demand
That’s why engineers have to specify the right sized pipes—not just for the main building intake, but for every pipe within the building. Getting that specification right depends on an accurate estimate of peak water demand—the maximum average load on the system in one hour.
If a building only had one fixture, estimating peak water demand would be easy. But the estimation gets complicated because:
- Even small buildings have several faucets and flushometers, and large buildings can have thousands of them
- Faucets and flushometers don’t run continuously, but only when people use them
- The building may have wide variables in population from one time of day to another, or one day to another
- Fixtures in different parts of the building may be set with different flow rates
- Multi-story buildings must employ mechanical pumps to overcome the loss of water pressure as water rises in vertical pipes
Roy Hunter’s ground-breaking paper in 1940 took these variables into account and became the standard for estimating plumbing system loads for generations of engineers. While Hunter’s system has greatly contributed to plumbing applications, it leaves some gaps for modern day plumbing systems.
Many engineers use the IAPMO calculator, which is based on Hunter’s curve, which doesn’t account for different water pressures or fixture flow rates.
That’s why Sloan’s Dr. Herbert developed a new formula.
Hunter’s Curve Explained—Without Calculus
Engineers may find this explanation overly simplified, but here it is for the rest of us who may not be as proficient at calculus!
Hunter’s curve assumes that every plumbing fixture has an expected on-time, during which it draws water at a specific flow rate for a specific duration of time. Every fixture also has a minimum expected time between uses, impacted by the number of people in the building and their behavior, and the properties of the fixtures.
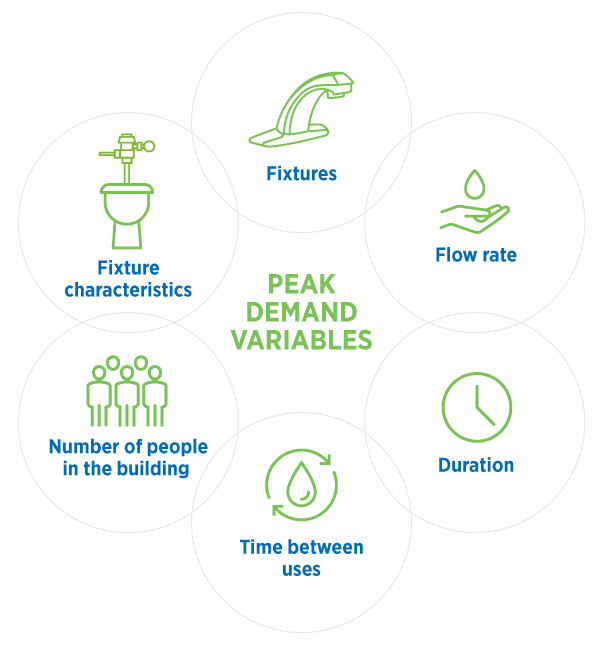
- Fixtures
- Flow rate
- Duration
- Time between uses
- Number of people in the building
- Fixture characteristics
Since several of these variables change drastically over time, estimating peak demand becomes a probability problem. Hunter proposed using the 99th percentile of each fixture’s likelihood of being in use—in other words, the most fixtures running at the same time—to create his probability curve.
However, Hunter had to assign arbitrary values to each fixture to account for multiple fixture types with different flow rates. That’s why Hunter’s method can be more than 20% wrong at estimating peak demand with modern fixtures.
How Convolution Conquers Complexity
When you account for all the probabilities for each variable, the complexity of accurately estimating peak water demand is truly staggering.
For instance: As water is pumped higher in a tall building, water pressure varies from one floor to the next. A flush valve set to a given flush volume will open for a shorter duration at higher pressure, translating to a lower probability the valve is open, which impacts the demand calculation. You can have a different calculation for every floor in the building.
According to Dr. Herbert, exact enumeration of all the variables in play requires 2n calculations—with n being the total number of fixtures in the building. A building with 1,000 fixtures would require 21000 calculations. Since that number has 302 digits, you’d need NASA-level computational power. Other methods are more accurate for large buildings but less accurate for smaller buildings.
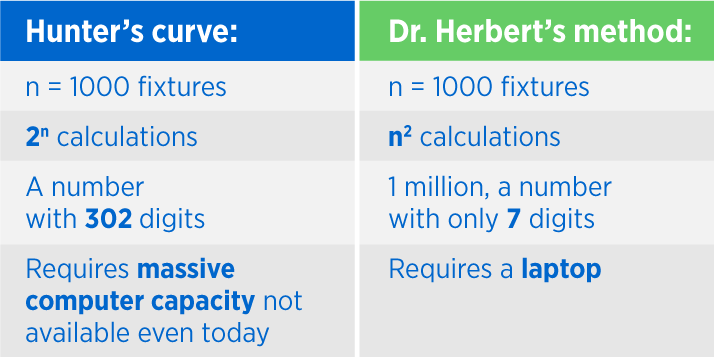
Hunter’s curve:
- n = 1000 fixtures
- 2n calculations
- A number with 302 digits
- Requires massive computer capacity not available even today
Dr. Herbert’s method:
- n = 1000 fixtures
- n2 calculations
- 1 million, a number with only 7 digits
- Requires a laptop
Dr. Herbert’s formula is the most accurate yet. It involves convolution—a mathematical operation on two functions that expresses how the shape of one is modified by the other. (For us non-mathematicians, Dr. Herbert describes it as “a fancy type of multiplication.”)
With convolution, the number of calculations required to account for all the probabilities in a peak demand estimate is only n2, where n is the total number of fixtures in the building. In a building with 1000 fixtures, that’s 10002, or one million calculations, which is a much lighter computational load.
How much lighter? Dr. Herbert runs it on a laptop.
Three Reasons to Use Dr. Herbert’s Formula
Why should you or the engineers on your team care about upgrading the accuracy of peak water demand estimates? There are three reasons.
- Cost. Dr. Herbert says most engineers, knowing their estimates can be off by as much as 20%, specify larger pipes than they need. They reason that it’s better to spend too much than to risk the pipes failing to deliver enough water during peak demand.
- Hygiene. These too-large pipes are more likely to retain standing water, which can breed legionella bacteria and other pathogens.
- Sustainability. Modern faucets and flushometers deliver optimal water-saving performance when they’re adjusted to the right flow rate. When engineers estimate peak water demand more accurately, they need flow rates to be accurate, too—so they’re more likely to inform installers of the correct flow rates to set.
Finally, estimating accurate peak water demand is just good engineering. With Dr. Herbert’s formula, there’s no excuse for anything less.
Make your peak water demand estimates as accurate as possible—download Dr. Herbert’s white paper, Gaining an Accurate Estimate of Water Demand in Buildings.
For improved hygiene and water sustainability, engineers worldwide rely on Sloan’s expertise. Want insights for your next project? Contact Sloan!
Stay Up to Date
Sign up for the Sloan blog to receive information on the latest trends in commercial building, technology advancements and product updates. It's the leading source of industry news for architects, designers, engineers and contractors.